75 – Public benefits, private benefits, incentives and lags to adoption
This is the third instalment of a series that examines a simple framework for choosing environmental policy instruments, as outlined in PD#73. The framework is based on levels of public and private net benefits of changing land management, and a set of simple rules. This time we focus again on positive incentives, allowing for the cost of learning and the reality that there are lags to the adoption of new practices.
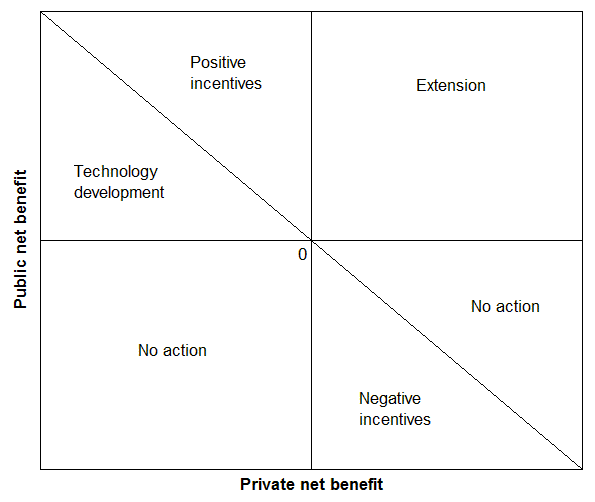
In PD#73 I showed how a set of simple and reasonable rules can lead to a map of efficient policy instruments (Figure 1). The context is an environmental manager considering prospective projects to change land use in particular ways on particular pieces of private land. The map shows that the choice of instruments depends crucially on the levels of public and private net benefits from a project. A particular project to change land use in particular ways on particular pieces of land would be represented by a dot somewhere on Figure 1. Depending on where the various dots lie, different types of policy response are recommended.
In PD#74 we focused on the “Positive incentives” triangle at top left. This time we further develop the framework for incentives, allowing for the possibility of paying incentives to accelerate adoption in the area that is currently labelled “Extension”
Figure 1. Efficient policy mechanisms for encouraging land use on private land.
The rationale for considering positive incentives in that area is that they may result in more rapid adoption than can be achieved through extension alone. Whether their benefits in this respect are worthwhile depends on how how slow adoption would have been without the incentives, and on the size of the incentives required.
In the simple framework of PD#73 and PD#74, we assumed that extension would be enough to prompt immediate adoption for any project in the “Extension” area. In reality, there are (a) lags to adoption that extension may shorten, but will probably not eliminate, and (b) costs and impediments to learning that must be overcome. Learning costs would include all factors that inhibit the transition from current management to the new management system. It may include the cost of obtaining and analysing information about the new practice, social pressures for or against its adoption, and constraints on financial equity. The existence of positive learning costs mean that landholders may not make the transition to a new practice, even if its adoption would ultimately yield positive private net benefits.
I will assume that in the “Extension” area, an incentive that is big enough to cover the costs of leaning will result in immediate adoption of the new land management system. In the “Positive incentives” area, the incentive needs to cover both the private net cost of the land-use change, and the costs of learning about it. I presume that the learning costs would be the same, regardless of the level of private net benefit.
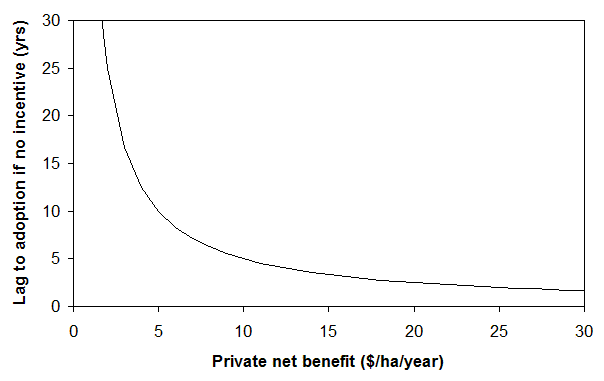
Even without extension or incentives, the lag to adoption would probably be low if private net benefits are high enough. As private net benefits fall, the lag (in the absence of incentives) would increase, and it would probably be very long indeed as the benefits of adoption are reduced to zero. Figure 2 shows a plausible relationship for adoption that we will use for illustration.
Figure 2. Possible lag to adoption as a function of private net benefit from adoption.
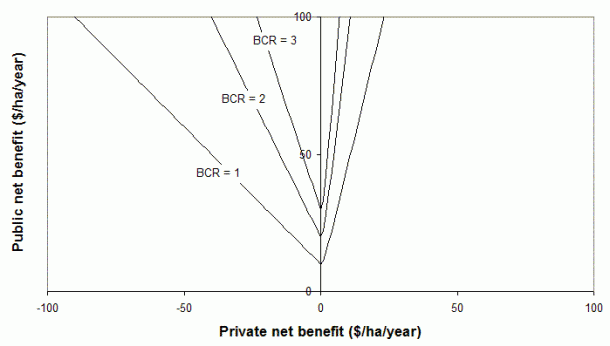
Combining Figure 2, with learning costs of $10/ha/year (annualised), and a real discount rate of 5 percent, we can map out the area of the figure where positive incentives would generate sufficient public benefits to be worthwhile: anywhere above the BCR = 1 line in Figure 3.
Figure 3. Benefit:cost ratios from use of incentives, allowing for adoption lags and learning costs.
This area differs from Figure 1 in two ways:
- The boundary of the positive incentives area (i.e. BCR = 1) has been raised by $10 in the left part of the figure, to cover learning costs. In other words, given higher costs of achieving land-use change, the resulting public benefits have to be correspondingly larger.
- There is now a small area in the right side of the figure where positive incentives reduce adoption lags by enough for it to be worthwhile putting incentives in place. They would be paid where private net benefits of changing land use are low (so that, without intervention, the lags to adoption are long) and public benefits are sufficiently high.
In the left part of the diagram, the boundary rises as we move away from the vertical axis because the required incentive is increasing. In the lower-left part of the diagram, it is not worth paying incentives because the incentives required are larger than the public benefits they would generate.
In the right part of the diagram, the boundary rises because the lag to adoption in the absence of incentives is falling, so the benefit of paying incentives is falling. In the lower-right part of the diagram it is not worth paying incentives because the lag to adoption without them is not sufficiently long (due to the large private net benefits) and hence the benefits of incentives are low, especially where there are also relatively low public net benefits from the land-use change.
Examining the three different BCR lines in Figure 3, for a given level of public net benefits, the benefit:cost ratio of applying incentives is highest where the private net benefits are zero. In applying incentives, we should be looking for cases where the practices we hope to get adopted are borderline in their adoptability. This is where incentives have the greatest scope for causing practice change most cost-effectively.
Figure 3 has strong implications for the targeting of positive incentives, including incentive payments and other economic instruments (e.g. “market-besed instruments” such as conservation auctions or tenders), and command and control regulation. If they are to generate substantial net benefits, these instruments need to be carefully applied. For example, to cover the transaction costs of a program, we might decide to seek projects that fall in the area above the BCR = 2 line. This presumes that there are, in fact, projects available within that area. If not, then positive incentives are not the right instruments to use.
It is notable that the positive incentives area is a relatively small sub-set of the total. A project chosen at random has only a small chance of falling into the positive incentives area. Environmental managers need to take care to ensure that they are not applying incentives to inappropriate projects. There seems a high risk of this if environmental managers use simple instruments like incentive payments (subsidies) unless they have very good information about both the public and private net benefits.
In my experience, environmental managers do pay attention to the environmental (public) benefits of their funded works, but often neglect the private benefits. This framework reveals that the selection of cost-effective environmental projects is probably even more sensitive to private benefits than to public benefits.
A well designed auction process should identify any projects that do fall into the relevant area of the graph, because it will find projects that offer the best cost-effectiveness. However, the possibility that even the best is not good enough should be considered. For example, in the case of dryland salinity in Australia, it seems likely that very few projects will fall into the positive incentives area (even less than suggested by its small size) because of the high cost of the substantial land-use changes required, and the limited responses of groundwaters to those changes in many cases. These would combine to push projects towards the lower left of the graph.
Next time we compare incentives with an extension-only strategy.
David Pannell, The University of Western Australia


