395. Should parks be less green?
Keeping urban parks green through Australia’s hot, dry summers uses a lot of water. Average rainfall has declined in Perth since the 1970s, reducing the supply of water and increasing the demand for irrigation. In a project led by Claire Doll we ask, what are community attitudes towards changing park designs to include larger areas of Australian native plants that require less irrigation?
We have a new paper about this out in the journal Ecological Economics, available here. It’s open-access until 12 July 2023.
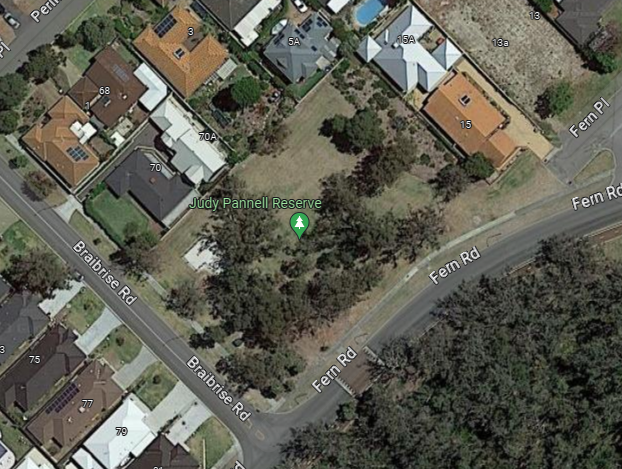
The focus of the paper is on smaller local parks, rather than larger parks used for sports. Currently, these local parks typically have about 80% of their area as watered grass and around 20% as mulch. In the suburb of Wilson there is a small park named after my Mum, Judy Pannell Reserve, that roughly matches that description.
In a choice-experiment survey of Perth residents, we found significant support for switching some watered grass to either native vegetation or non-watered grass.
Using a statistical model, we identified different groups in the community with different attitudes and preferences. Even though the groups are rather varied in their preferences, Figure 2 shows that all of them would be happy to see a big increase in the area of native vegetation, with one group even going for 100%. A couple of groups would also like to see some of the grass left unwatered, suggesting that water conservation is a driver of these preferences. But it’s not the only driver. Even the first group, which says it has no concerns about water scarcity, would like to see around 38% of the park area devoted to native vegetation.
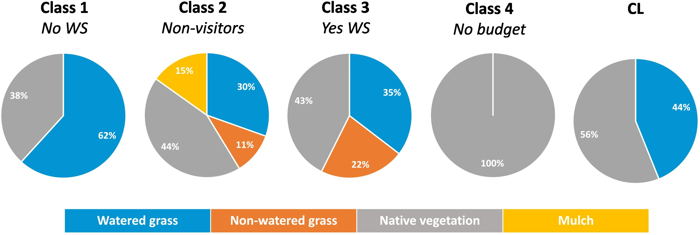
Yes WS = Concerned over issues related to water scarcity.
No WS = Not concerned over issues related to water scarcity.
Non-visitors = Stated they do not visit parks at least once per month.
No budget = Stated they did not consider their budget when responding to choice exercises.
LC = results from the base conditional logit model (not broken down by class)
We also explored how people in each group would feel about varying the proportion of watered grass across the full range from zero to 100%. Figure 3 shows results for one of the groups, Class 2, whose members don’t often visit local parks. The height of the line indicates how much they would be willing to pay each year to switch their local park from 80% watered grass to some other percentage.
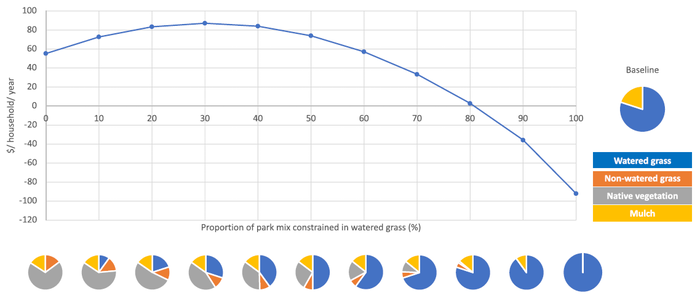
Interestingly, there is a fairly wide range of percentages (10 to 50%) that they view as being pretty good. Within that range, they don’t really mind what the percentage is, but any percentage in that range would clearly be better than the current 80%. The graph also shows that these people would feel quite negative about increasing the percentage of watered grass above 80%. Results for the other groups are in the paper.
The little pie charts below the line graph show how the optimal mix of groundcovers varies as we go from zero to 100% watered grass, for people in Class 2. It’s quite neat to track how the optimal mix varies from right to left. We see that as we go to lower percentages of watered grass, the main groundcover that replaces it is native vegetation.
The results indicate that there are untapped opportunities to save water in Perth’s local parks. As you can imagine, the Department of Water and Environmental Regulation in Perth has been really interested in these results.
Further reading
Doll, C.A., Burton, M.P., Pannell, D.J., and Rollins, C.L. (2023). Are greenspaces too green? Landscape preferences and water use in urban parks, Ecological Economics 211, 107896. here
Great insights. Thank you for sharing.
Thanks Yusuf.
When I worked in the Environment Branch in Brisbane City Council decades ago, there was often internal conflict on how best to deal with open space contribution from developments. The Parks people wanted grassed areas to allow people to ‘kick the footy around’. While the Environment people wanted native vegetation. The two camps were referred to jokingly as the ‘mow-its’ and the ‘grow-its’.
🙂 We’ve found the same dichotomy in Perth when we looked at attitudes to different groundcovers on verges (street lawns). Some people want more native veg, but others strongly prefer watered grass.
Nice to remember your Mum this way Dave.
Thanks Rob. They’ve recently upgraded the park quite a bit, which is really nice.
nice info
thanks
Terimakasih artikel nya sangat membantu.