423. Risk aversion versus loss aversion, part 1
Risk aversion and loss aversion are two theories of how people make decisions under risk. They overlap in some ways but they also have some important differences. What are they and how do they differ?
Before I start, I’ll warn you that this PD and the next one are a bit more technical and probably less practically relevant than the other posts in this RiskWi$e series. I think the topic is worth covering because the issues are interesting and sometimes misunderstood, but if you find it too abstract that’s fair enough.
I outlined the concept of risk aversion in PD409. A version of this theory has been around for about 300 years. (If you’re interested in its history, “Against the Gods: The Remarkable Story of Risk” by Peter Bernstein is highly recommended.) I’ll call this the traditional theory of risk aversion.
Loss aversion is a newer theory, devised by Kahneman and Tversky (1979). It’s one component of Prospect Theory, which I’ll expand on below.
For this post, I originally set out to talk about empirical evidence on these theories, but then I realised that I first need to explain what they are. So I’ll do that here and look at the evidence in the next post.
In my view, much of what is written about loss aversion is not very helpful in explaining how it differs from risk aversion. In general accounts of behavioural science/behavioural economics (e.g. Kahneman, 2011), when describing loss aversion they tend to make two points: (a) that it’s a more sophisticated and more realistic theory than risk aversion, and (b) that it says that people generally give more weight to losses than to gains.
Kahneman certainly makes point (a). For example, he says:
- “The theory we had rejected [traditional risk aversion] now seemed not only false, but absurd.”
- “The concept of loss aversion is certainly the most significant contribution of psychology to behavioral economics.”
As you’ll see in the next post, I’m not convinced that things are as clear-cut as that makes it sound.
He also emphasises point (b), with comments such as the following.
- “When directly compared or weighted against each other, losses loom larger than gains.”
- “The response to losses is stronger than the response to gains. This is loss aversion.”
While it’s true that the theory of loss aversion says that people give more weight to losses than to gains, the problem is that the traditional theory of risk aversion does that too, so this description alone doesn’t actually distinguish between the two theories.
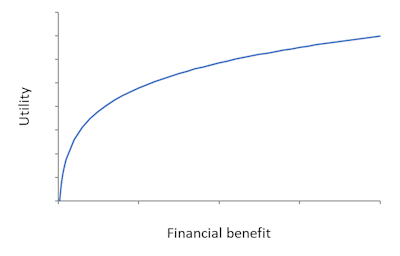
To understand the similarities and differences, we need to look at two graphs. Figure 1 is for the traditional risk-aversion theory. It shows the relationship between the outcomes from a risky prospect and the utility experienced by the decision maker. “Utility” means the general satisfaction or pleasure that the decision maker gets from a particular outcome.
As the outcome (the financial benefit) gets higher, utility gets higher as well, but it tends to flatten off. It increases at a decreasing rate. This flattening off is the explanation for risk aversion. Relative to the expected value of the probability distribution of outcomes from a decision, high financial benefits make a smaller difference to utility than low financial benefits. Utility drops more quickly moving to the left than it rises moving to the right. In other words, a risk-averse decision maker gives more weight to losses than to gains. That’s true for losses and gains starting at any point along the utility curve. The more bendy the utility curve is, the greater is the emphasis given to losses relative to gains, and the more risk-averse the decision maker is.
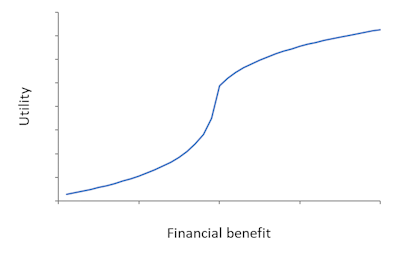
Figure 2 shows the equivalent graph for prospect theory. It too depicts that utility increases with increases in the financial benefit, but the shape is more varied and complicated. The first difference from Figure 1 is the distinct corner in about the middle of the line. This corresponds to a reference point, which could be, say, the expected value of the risky prospect being considered. The idea is that the decision maker evaluates utility relative to that reference point. Above the reference point, the utility curve rises but flattens out as you move further to the right (to higher financial benefits). Just to the left of the reference point, utility falls rapidly initially but then flattens out as you move further to the left. (There is another element of Prospect Theory that I’m not going to talk about here: probability weighting.)
So although both theories predict that losses loom larger than gains, the difference is that traditional risk aversion predicts a slow and smooth increase in the weight given to losses as one moves left in the utility graph, whereas the theory of loss aversion that is part of Prospect Theory predicts a sudden dramatic increase in the weight given to losses to the left of the reference point.
The position of the reference point is whatever the decision maker chooses to use, which could be different for different decisions. If the position of the reference point shifts, the whole utility curve is different. This contrasts with the utility curve in Figure 1, which is usually assumed to be constant over different decisions. It’s not clear from Prospect Theory where the reference point will be or should be.
The implications of the shape of the utility function in Figure 2 are that (a) if all the outcomes of the risky prospect are to the right of the reference point, the decision maker behaves as risk-averse, (b) if all the outcomes of the risky prospect are to the left of the reference point, the decision maker behaves as risk-seeking, and (c) if the outcomes of the risky prospect are spread either side of the reference point, the decision maker could behave as risk-averse, risk-seeking or approximately risk-neutral, depending on the specifics. I’ve not seen implication (c) mentioned anywhere else, but it follows logically from the shape of the utility curve.
Interestingly, the novel part of prospect theory is not the idea that losses loom larger than gains, which tends to get most of the attention, but rather the presence of a sharp corner at the reference point and the risk-seeking shape of the utility curve to the left of the reference point. (And the issue of probability weighting, which I’m not discussing here.)
In part 2 (PD424), I’ll look at what empirical evidence says about the realism of these theories.
Further reading
Bernstein, P. (1996). Against the Gods: The Remarkable Story of Risk, Wiley.
Kahneman, D. (2011). Thinking, Fast and Slow, Farrar, Straus and Giroux, New York.
Kahneman, D. and Tversky, A. (1979). Prospect theory: An analysis of decision under risk, Econometrica, 47 (2), 263-291.
This is #16 in my RiskWi$e series. Read about RiskWi$e here or here.
The RiskWi$e series:
405. Risk in Australian grain farming
406. Risk means probability distributions
408. Farmers’ risk perceptions
409. Farmers’ risk preferences
410. Strategic decisions, tactical decisions and risk
412. Risk aversion and fertiliser decisions
413. Diversification to reduce risk
414. Intuitive versus analytical thinking about risk
415. Learning about the riskiness of a new farming practice
416. Neglecting the risks of a project
418. Hedging to reduce crop price risk
419. Risk premium
420. Systematic decision making under risk
421. Risk versus uncertainty
422. Risky farm decision making as a social process
423. Risk aversion versus loss aversion, part 1 (this post)
424. Risk aversion versus loss aversion, part 2
433. Depicting risk in graphs for farmers

Excellent summary David