414. Intuitive versus analytical thinking about risk
In his famous book, “Thinking, Fast and Slow”, Daniel Kahneman introduced many people to a wealth of research about how people make judgments and decisions, much of it in the context of risk.
In this post I focus on the issue that gave his book its title. Kahneman and his colleagues were very interested in a range of quirks in our thinking that can occur when we think quickly and intuitively about an issue (using what they called System 1 thinking) rather than slowing down and thinking in a more analytical way (System 2 thinking).
Sometimes intuitive thinking can be very powerful, particularly when it is about a situation that we have experienced many times and about which we’ve received rapid, accurate feedback about the quality of our previous judgments. For example, an experienced mechanic can often tell what’s wrong with a car based on a limited description of the symptoms.
But other times, intuitive thinking can lead us into biases or misjudgments, particularly if it relates to a complex, highly variable system and we don’t have a history of getting rapid, accurate feedback about our judgments. An enjoyable and fascinating aspect of Kahneman’s book is learning about the wide range of ways that our intuition can lead us astray.
Little of the research in this field relates specifically to farmers. Based on what we know from research on people working in other fields, like medicine and business, I’m going to try to give a flavour of how things are likely to be in agriculture, but I acknowledge up front that the research this is based on is not agriculture-specific. Still, it’s about people in general, so it’s relevant to farmers.
One of the things we do when trying to interpret or understand a complex (and probably risky) situation is look for patterns and causes. Our brain is so attuned to doing this that it is likely to recognise patterns and infer causes even if we are just observing random fluctuations with no real pattern or cause.
Secondly, our intuitive brain likes a coherent story. If it is able to put together a story that hangs together and seems to make sense to explain a situation, it is liable to assume that this story is the true cause of the situation being observed, even if it isn’t.
And thirdly, our intuitive brain tends to draw on memories of past events or experiences that are most easily remembered, perhaps because they are most recent or they stand out for some other reason. Kahneman calls this “availability bias”.
For example, suppose nitrogen fertiliser is particularly expensive one year, and a farmer, Dave, understandably decides to apply less of it to his cereal crops, say 35% less than usual. Unfortunately, the cereal crops end up yielding poorly, and Dave makes much less net revenue than average. A careful weighing up of the causes for the bad result would indicate that it was mainly caused by factors out of the farmer’s control: below-average rainfall, and a very hot week in spring. But Dave had agonised over how much nitrogen fertiliser to apply, so that issue is front of mind. As a result, low fertiliser rates feel like they were probably an important contributor to the low yields. Other farmers in the district had also cut their rates, and they got low yields as well. This gives Dave more confidence in his intuitive judgment.
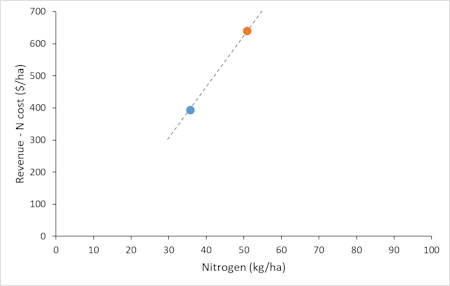
Dave’s superficial, intuitive (system 1) interpretation of what’s going on is shown in Figure 1. Last year, an average growing season, he’d applied his usual nitrogen rate of 52 kg/ha and made net revenue (revenue minus N costs only) of $640/ha. This year, he applied 34 kg/ha and made only $390/ha.
It wouldn’t take much thinking from Dave’s system 2 brain to realise that this is overstating the impact of reducing his N rates, but Figure 1 shows the feeling that is lurking in Dave’s System 1 brain.
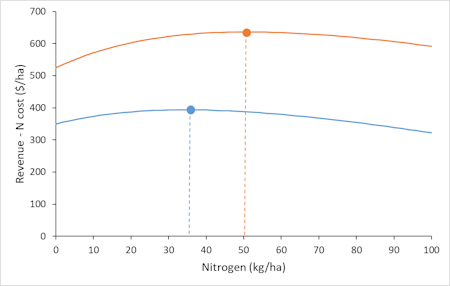
Figure 2 shows what is really going on. If Dave had applied his usual N rate this year, his net revenue would have moved to the right along the blue line (until it reached the point where the blue line is crossed by the dashed orange line) and the end result would have been hardly any different from what it actually was. In fact, net revenue would have been slightly lower at the higher nitrogen rate, rather than substantially higher, because the weather has reduced yields at every nitrogen rate. By thinking more analytically about the situation (employing System 2 thinking), Dave could easily recognise that the true situation is much closer to Figure 2 than to Figure 1. But Figure 1 is a simple pattern with a seemingly coherent story behind it, and the memory of having cut N rates is particularly “available” to Dave, so the risk is that, even if Dave realises that Figure 1 is not the whole story, it will still be given more weight in his thinking than it should be.
I could imagine Dave deciding, as a result of this experience, to avoid cutting his nitrogen rates in later years, if possible. If so, it would probably cost him money the next time fertiliser prices were high or grain prices were low, because cutting rates is economically sensible in those cases. Mind you, given how flat the net revenue curves are in Figure 2, it wouldn’t cost him much.
The reason Figure 1 is not ruled out in Dave’s brain is that the shapes of the curves in Figure 2 are not easy to observe. It’s not a matter of just looking at the curve for this year and reading off the best rate. Even thinking about past years, the shape of the curve isn’t necessarily apparent, unless Dave has done trials with a wide range of nitrogen rates (which would be unusual).
On the other hand, for this example of choosing nitrogen rates, the fact that the net revenue curves are so flat substantially reduces the importance of risk. Whatever the actual curve is in a particular year (e.g., the orange one in an average year or the blue one in a particular bad year), getting the nitrogen rate wrong doesn’t make much difference to net revenue, as long as it’s not wildly wrong. This explains the pattern of risk by nitrogen rate shown in Figure 1 in PD412. Risk doesn’t vary much at different rates because, in any one year, net profit doesn’t vary much at different rates.
Further reading
Kahneman, D. (2011). Thinking, Fast and Slow, Farrar, Straus and Giroux, New York.
This is #8 in my RiskWi$e series. Read about RiskWi$e here or here.
The RiskWi$e series:
405. Risk in Australian grain farming
406. Risk means probability distributions
408. Farmers’ risk perceptions
409. Farmers’ risk preferences
410. Strategic decisions, tactical decisions and risk
412. Risk aversion and fertiliser decisions
413. Diversification to reduce risk
414. Intuitive versus analytical thinking about risk (this post)
415. Learning about the riskiness of a new farming practice
416. Neglecting the risks of a project
418. Hedging to reduce crop price risk
419. Risk premium
420. Systematic decision making under risk
421. Risk versus uncertainty
422. Risky farm decision making as a social process
423. Risk aversion versus loss aversion, part 1
424. Risk aversion versus loss aversion, part 2
433. Depicting risk in graphs for farmers

Farming is different, and farmers who aren’t flexible, are challenged moreso than those who can deal with rainy days, dry days, bog holes and blights. They do need to tools, for decisions like the one you are exploring. But they pick that tool up or put it down, and stay flexible.