409. Farmers’ risk preferences
Risk perceptions and risk preferences are different. Risk perceptions (covered in PD408) are about how risky someone thinks a particular strategy is. Risk preferences are about how much the person cares about the riskiness of a strategy.
Suppose a mixed crop/livestock farmer believes that cropping is more risky than livestock production. Will that influence his or her decisions about the balance between crop and livestock production in their farm business strategy?
It depends on their “risk preferences” or “risk attitude”.
If the farmer is “risk averse”, then yes, there will be a tendency to devote more resources to livestock production and less to cropping, relative to the strategy that would maximise expected profit. (Note: it’s “risk averse”, not “risk adverse”, which I sometimes hear people say.)
If the farmer is “risk neutral”, the riskiness of the options doesn’t matter, and the aim is to maximise expected profit.
If the farmer is “risk seeking” or “risk loving” then cropping would be increased relative to the expected-profit-maximising strategy.
Note that there is no right or wrong to this. A person’s risk preferences are as personal to them as their preferences for different types of music. Any risk preference is legitimate, if it’s what you feel.
There have been many studies around the world (including in Australia) measuring the risk preferences of farmers, using a variety of techniques. Some researchers use surveys or interviews to ask farmers what decisions they would make in different risky situations. Some look at what farmers do in certain games or experimental situations that involve risky decisions. Some collect data about the actual farming decisions of large numbers of farmers and use statistics to infer the risk preferences of the farmers who made those decisions.
Across all of these studies, the findings are consistent in many respects. Here are some things we know with high confidence.
- Most farmers are risk-averse.
- In developed countries, some farmers are risk-neutral and a few are risk-seeking.
- In developed countries, of the commercial farmers who are risk averse, most are not very risk averse.
- Smallholder farmers in developing countries tend to be more risk-averse.
The finding that most commercial farmers are not very risk-averse is easy to understand. There is so much risk in agriculture that people who are naturally highly risk-averse would not choose to be farmers. They would probably sell out to someone who is less risk-averse.
There are also some research findings that show that risk preferences are more complex than the standard simple model would suggest. For example, the standard model assumes that people apply the same risk preferences in all their decisions, but some research finds that farmers can have different risk attitudes in different types of decisions.
In the standard theory, there is no reason to expect that there would be any correlation between risk perceptions and risk preferences. A farmer who is risk-averse could be optimistic or pessimistic about how risky a certain decision option is. However, recent work in Michigan found that risk-averse farmers tended to perceive things as being more risky. For these farmers, risk has a double-whammy effect: they think outcomes are relatively risky, and they care more about risk. We don’t have evidence about how widely applicable this finding is.
What is risk aversion?
I’m going to avoid equations and most of the technical details of the standard theory about risk preferences (which is called “subjective expected utility theory”). I’m ignoring some alternative theories of risk preferences for now. I’ll cover at least one of them in a future post.
The essential insight about risk aversion is that, when comparing different risky options, risk-averse people are prepared to trade off some expected profit if it allows them to reduce their exposure to risk. In this theory, “risk” means the variability of outcomes, or the standard deviation of the probability distribution of outcomes (see PD406).
To illustrate, Figure 1 shows the (hypothetical) probability distribution of gross margin for two nitrogen fertiliser rates applied to a wheat crop. In this hypothetical example, the expected profit for 80 kg N/ha is $461/ha, which is higher than for 50 kg N/ha, $416/ha. Visually you can see that the peak of the lower graph is a bit further right than the peak of the upper graph.
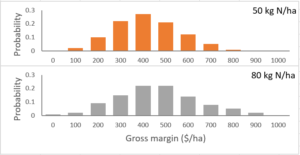
You can probably also see that the standard deviation for 80 kg is a bit higher than for 50 kg ($181 versus $144). The 80 kg option has a slightly higher probability of getting a gross margin of zero, but also higher probabilities of getting high gross margins.
Now, a risk-neutral farmer would not care about the greater riskiness of 80 kg and would choose that rate because it has a higher expected profit. But a risk-averse farmer would pay attention to the riskiness of the two options. Whether they prefer 50 kg or 80 kg will depend on how risk-averse they are.
If they are only slightly risk averse, they will put up with the higher riskiness of 80 kg. They are not attracted enough to the lower riskiness of 50 kg to put up with its lower expected profitability.
But if they have high enough risk aversion, they’ll prefer 50 kg despite its lower expected profit.
Note that this way of considering risk includes both upside and downside risk. A risk-averse person doesn’t ignore upside risk but gives more weight to downside risk. How much more weight depends on their degree of risk aversion.
It can be helpful to be able to put a number on someone’s risk aversion. There’s more than one way to do this, but the measure I’ll talk about is called the coefficient of Relative Risk Aversion (RRA). Even without going into the maths behind this, it’s not hard to understand what different levels of RRA mean.
- A person with RRA = 0 is risk-neutral.
- RRA between 0 and 1 is slightly risk-averse.
- RRA between 1 and 2 is moderately risk-averse.
- RRA between 2 and 3 is highly risk-averse.
- RRA over 3 is extreme.
As I said earlier, most commercial farmers in Australia are slightly risk-averse, so they have RRAs between zero and 1. They are prepared to sacrifice a bit of expected profit if that helps them avoid some risk, but not much. Or, tying it back to my opening example, they would have some leaning towards more sheep/pasture and less crop, but only slightly so. If they had to sacrifice more than a small amount of expected profit by switching their production emphasis towards more sheep, they wouldn’t do it.
Further reading
This is #4 in my RiskWi$e series. Read about RiskWi$e here or here.
405. Risk in Australian grain farming
406. Risk means probability distributions
408. Farmers’ risk perceptions
409. Farmers’ risk preferences (this post)
410. Strategic decisions, tactical decisions and risk
412. Risk aversion and fertiliser decisions
413. Diversification to reduce risk
414. Intuitive versus analytical thinking about risk
415. Learning about the riskiness of a new farming practice
416. Neglecting the risks of a project
418. Hedging to reduce crop price risk
419. Risk premium
420. Systematic decision making under risk
421. Risk versus uncertainty
422. Risky farm decision making as a social process
423. Risk aversion versus loss aversion, part 1
424. Risk aversion versus loss aversion, part 2
433. Depicting risk in graphs for farmers