408. Farmers’ risk perceptions
Some risks can be measured fairly objectively, while for others there is little objective evidence to go on. Either way, what drives farmers’ decisions is their own perceptions of the risk. Their perceptions may or may not line up well with objective measures.
In PD406, I described how risk can be captured as a probability distribution of the outcome that matters to the decision maker (e.g., the probability distribution of farm profit). A key question is, where do those distributions come from? For a farmer wanting to manage risk well, how do they decide on which probability distributions to use?
I’m not assuming here that farmers are going to be developing Decision Theory models and doing lots of calculations with probabilities. Their use of the information is going to be more informal than that (although I will talk in a future post about practical options for being a bit more systematic when considering risky decisions).
Except in extremely simple cases (like tossing a coin), we never have reliable, totally objective information about the riskiness of a decision. Agriculture is far too complex for that. However, in cases where a suitable computer model is available, it might be possible to estimate the probability distribution of important outcomes reasonably well. For example, a crop model like APSIM can be used to simulate crop yields under many different rainfall conditions, and provided we can say something about the probabilities of the rainfall scenarios, we can convert the results into a yield probability distribution.
In the absence of modeling results, farmers have their own experiences to draw on. They can think about the range of yields they’ve had in say the past decade, factor in whatever they know so far about the weather in the current season, make an allowance for changes in technology (e.g., new crop varieties), and predict a yield distribution subjectively. It’s an all-things-considered judgment based on what they consider to be relevant, and whatever information is available about those things.
It’s similar for prices. There is no equivalent of a crop simulation model for predicting grain prices, but at any point in time there is a lot of information available that can help us make a prediction, and there are experts who make such predictions. In doing so, they probably consider information about weather in different parts of the world, existing grain stocks in storage, input costs, changes in trade restrictions, and any unusual factors influencing demand. Futures prices should, in principle, factor in those things too, so they can be viewed as a prediction, though the specific crop type defined for a particular futures market may not match what a particular farmer will grow (basis risk).
Farmers could also consider the same factors as those experts, as well as weighing up how much confidence they’ve got in different experts who are making predictions. Again, they can then make an all-things-considered judgment about the expected price and, at least notionally, the probability distribution around that expected price.
Can farmers actually come up with probability distributions?
Yes, they can. I’ve been involved in a couple of projects where we’ve interviewed farmers at the start of the season and asked them to estimate the probabilities of different outcomes at the end of the season. We were able to get them to come up with probability distributions of yields for wheat and chickpeas and of the price for wool. In general, the interviewed farmers were comfortable with the task and, with some thought, were able to come up with their subjective probability distributions. Many of them told us they quite enjoyed it, as it got them to think about things in a way they would not normally do, but which drew on their existing knowledge in a way that made sense to them.
On the other hand, we came to the view that there was scope to help farmers improve their subjective estimation of probabilities because there was a lot of variation between the different farmers – much more than could be accounted for by differences in their farms, locations, or whatever.
Farmers have varying perceptions
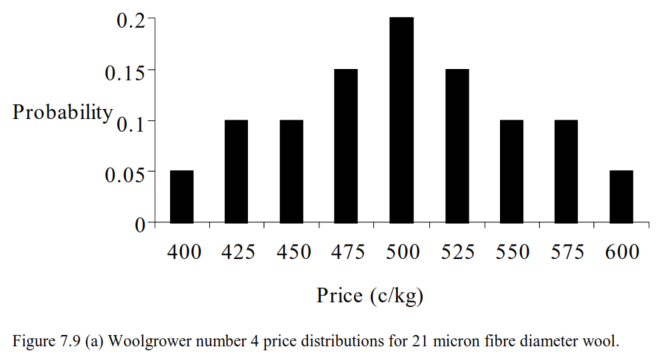
To illustrate the degree of variation, here are subjective probability distributions for 21 micron wool price provided by three Western Australian farmers in the same month back in the late 1990s. These are taken from Amanda Coad’s PhD thesis.
Woolgrower 4 had a symmetrical distribution with a mean of 500 c/kg but thought there was plenty of chance that the price could be higher or lower than that.
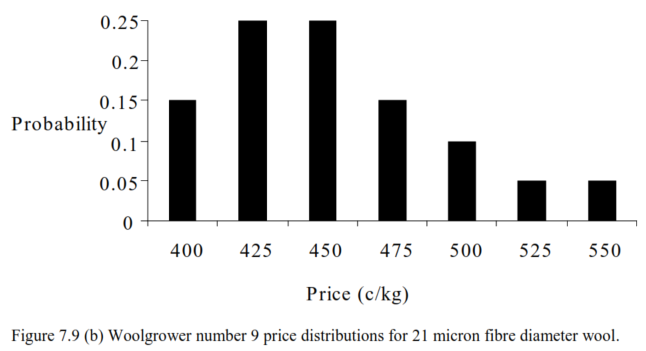
Woolgrower 9 was relatively pessimistic, and allocated most probability weight to relatively low prices but felt there was some (small) chance of relatively high prices.
Woolgrower 11 was relatively optimistic, with most probability weight assigned to prices between 510 and 530 cents. Nevertheless, the farmer wasn’t ruling out any other price between 450 and 550.
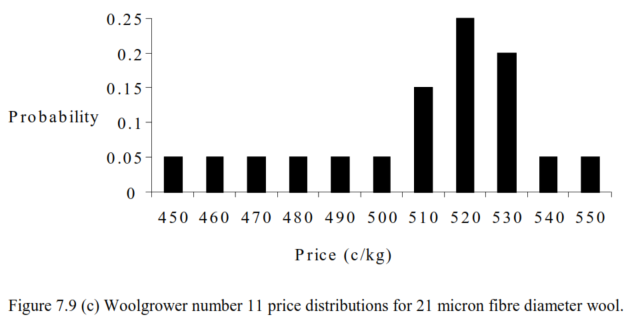
These farmers would have had access to similar information and advice, and wool was an important income source for them so they had incentives to pay attention to what its price was doing, but even so, they had quite different perceptions from each other regarding expected price and price risk. This level of variation in perceptions was typical across all the interviewed farmers. The high variability of perceptions about risk (and, indeed, expected values) suggests that a more evidence-based and systematic approach to thinking about predictions of risky variables might be beneficial.
Further reading
This is #3 in my RiskWi$e series. Read about RiskWi$e here or here.
405. Risk in Australian grain farming
406. Risk means probability distributions
408. Farmers’ risk perceptions (this post)
409. Farmers’ risk preferences
410. Strategic decisions, tactical decisions and risk
412. Risk aversion and fertiliser decisions
413. Diversification to reduce risk
414. Intuitive versus analytical thinking about risk
415. Learning about the riskiness of a new farming practice
416. Neglecting the risks of a project
418. Hedging to reduce crop price risk
419. Risk premium
420. Systematic decision making under risk
421. Risk versus uncertainty
422. Risky farm decision making as a social process
423. Risk aversion versus loss aversion, part 1
424. Risk aversion versus loss aversion, part 2
433. Depicting risk in graphs for farmers

Very helpful discussion